

The 2024 election is about to kick into fifth gear — we'll help you prepare for the home stretch.
I’m Ari Weitzman, and this is Tangle: an independent, nonpartisan, subscriber-supported politics newsletter. Today I'm subbing in for Isaac Saul, our executive editor, to share a piece on how to prepare for the next two months leading into the election.
As November draws near, election coverage is going to get more and more ubiquitous. You’re going to hear about dozens of “game-changing” narratives, see a news story every time a new poll gets released, be inundated with countless takes about how candidates are performing on the campaign trail, and read an opinion attached to every piece of news saying how it’s going to affect the presidential election.
At Tangle, we do our best to separate the noise from the news and focus on each story in its own right. But campaign events are often news in their own right, and we know that the race between former President Donald Trump and Vice President Kamala Harris is going to consume more and more of the oxygen in the room the closer we get to November.
By nature, election coverage is hyperventilatory, and we’ve all got to focus on our breathing. So today, I want to hand you an oxygen mask.
New polls are going to be released every week — you should know how they work. Headline coverage about election forecasting is going to get louder — you should know how to interpret them. And each campaign is going to work overtime to tell you why their preferred issues should be central, what fundamental details provide the framework for this election, and then spin the news as we approach each milestone. We’re going to tell you what the game is, and how the Democrats and Republicans are playing it.
How polls work.
Yesterday afternoon, Scott Keeter joined Isaac and me for the first part of our Sunday podcast to talk about how polls work. Suffice it to say, Scott knows what he’s talking about; he is a senior survey advisor at Pew Research Center, where he provides methodological guidance to all of Pew’s research areas. Before that, Scott was Chair of Public & International Affairs at George Mason University and Chair of Political Science and Public Administration at Virginia Commonwealth University. He has also published four books about U.S. politics, polling, and how they continue to evolve.
At their most basic level, surveyors like Scott Keeter are statistical journalists: They craft polls to give all of us information about what citizens think and believe. Keeter told us about the methodology that Pew uses.
“We recruit a group of people using a very rigorous and large mail survey to people's residential addresses with incentives — meaning money — telling people that we would like for them to take surveys with us,” Keeter said, noting that participants usually get somewhere between $5 and $20 per survey. “If they agree, we will impanel them and put them into our American Trends Panel, which currently has over 10,000 people in it. We use this panel two or three times a month to survey the American public — a representative sample of the American public — on various topics, including the election.”
Just this week, Pew released a new poll on the state of the presidential race that showed a dead heat: 49% for Harris, and 49% for Trump. The poll surveyed the American Trends Panel (ATP) that Keeter described, with a response rate of 91% and a margin of error of 1.3%. This poll follows a standard methodology Pew uses for their ATP polls, where they “recruit people by mail, but they take their surveys online,” as Keeter said, adding that they include an option to reach panelists by phone.
In order to make its results as reflective of the voting population as possible, Pew — like all polling outfits — has to adjust its sample to make their results more accurate.
“We recruit what we hope to be a random sample of the public, but inevitably better educated people, older people, and non-Hispanic white people are more likely to take our surveys than other kinds of people,” Keeter told us. “So we use a couple of different techniques to try to fix that. The one that's most common through the industry is called statistical weighting, which is simply that the people that we get who don't have a college degree or are in other demographic categories that are underrepresented — like younger adults, people under 30, for example — we simply give them more statistical weight when we tally up the totals. That goes a long way to correcting the biases.”
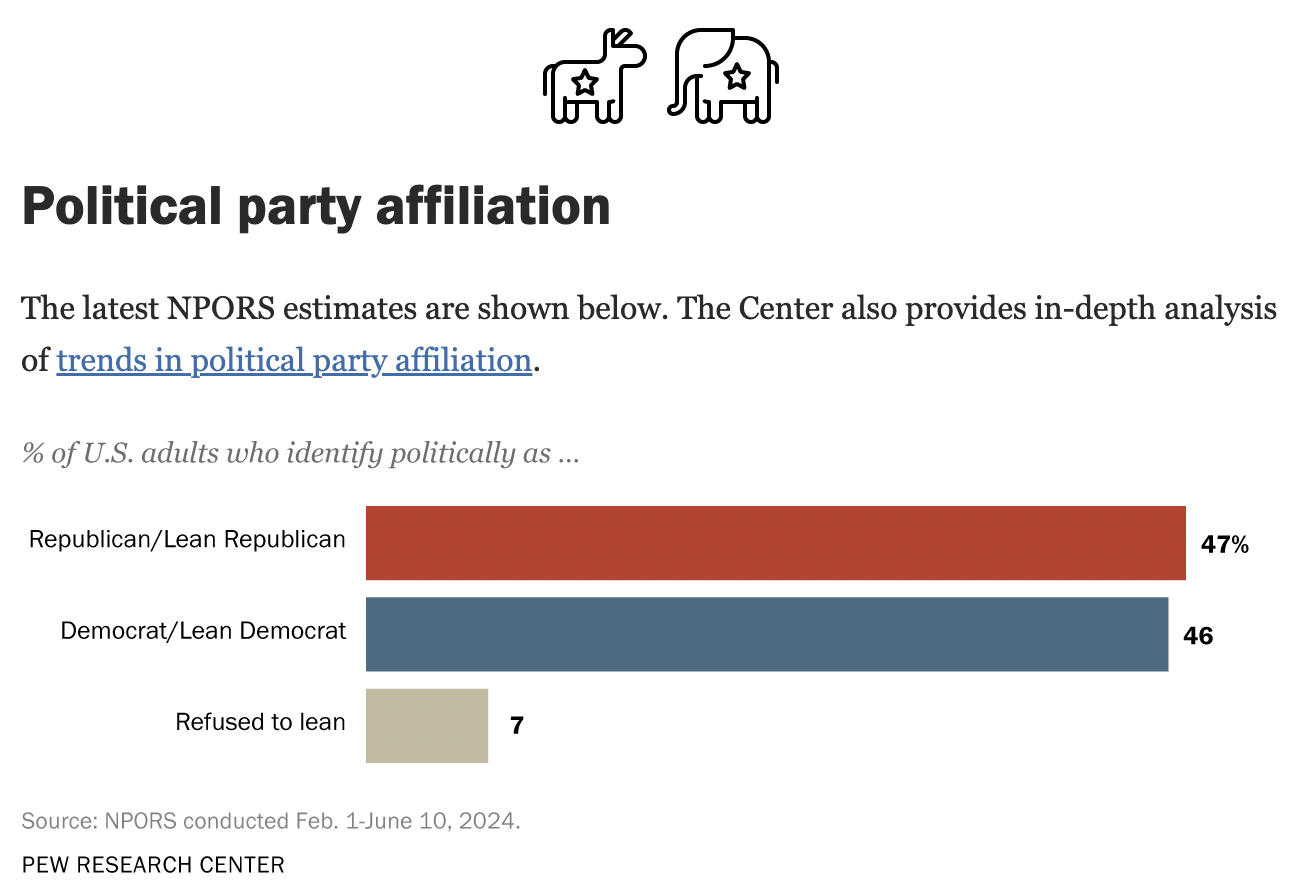
Lastly, they weight these panel results to account for the political affiliations of the electorate they’re polling, which they derive from a separate survey on the views of the American public. Every year, Pew performs a survey called the NPORS — the National Public Opinion Reference Survey. Pew spends hundreds of thousands of dollars working to get a random sample of American adults and then make it as easy as possible for them to respond to their survey, allowing respondents to answer either online or through the mail and offering cash incentives to do so.
“Other pollsters are using a similar method,” Keeter told us. “In fact, some pollsters are using our NPORS numbers to weight their surveys.”
According to the latest NPORS, 47% of U.S adults lean Republican, 46% lean Democrat, and 7% refused to lean one way or the other.
Polling v. forecasting.
Pollsters are very interested in providing snapshots in time as accurately as possible. As citizens keeping up with the news, it is tempting to look at these snapshots and plot them over time to create a kind of movie — to watch the presidential race like a literal race. Through this “horse race” model, when you put all the polls together over time, you can get a sense of direction and momentum.